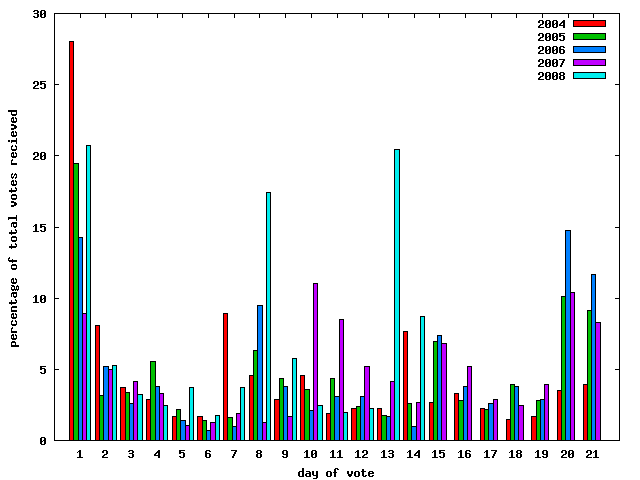
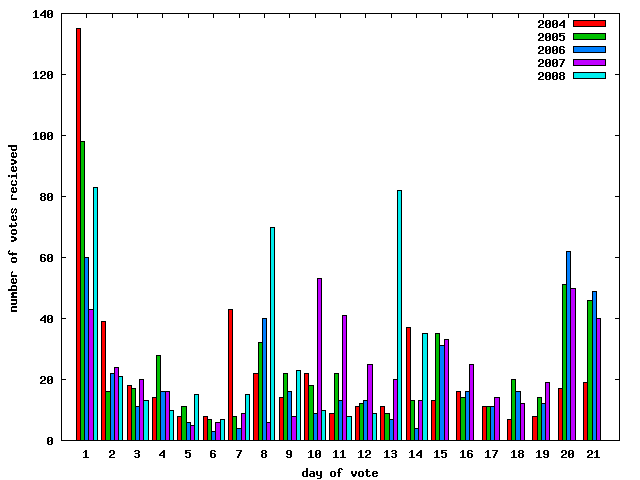
These graphs can help give some idea of how the shortened DPL voting period this year changed voting patterns.
Each vote starts on a Sunday (except 2005 which was a day late). Calls for votes are posted again each weekend during the vote, and a final call two days before the end of the vote. These are responsible for most of the spikes on the graph, and the trail off after each CFV is probably due to some people seeing it the next day.
Shortening the voting period seems to have made more people respond to the second and third CFV (both in percentage and absolute number of voters). It's also interesting that a smaller percent than usual of votes were recieved on the last day this year. There seems to not have been a rush to vote on the last day despite the shortened period.
I wonder if posting CFVs more frequently would result in more voters, or if it would just level off the graph?
(Graph produced using this tool and final vote timing logs provided by Manoj.)